About Lyft Perception Challenge
May 31, 2018
2 mins read
The goal
The overall goal of the Challenge is to generate a binary labeled image masks for vehicles and a binary labeled image for the drivable surface of the road.
The challenge was open from May 1st 10:00 am PST to June 3rd at 6:00 pm PST. There were 155 participants who submitted anything to the leaderboard.
Evaluation
The final metric is based on pixel-wise F-beta scores. The F-beta score can be interpreted as a weighted harmonic mean of the precision and recall, the score value spans in range [0..1].
An arithmetic mean of F0.5(road) and F2(car) is used to evaluate the submission (Favg):
Favg = (F0.5(road)+F2(car))/2
A penalty for running prediction at rate less than 10 FPS is also applied:
Penalty = (10 - FPS) > 0
So, the final score (S) is:
S = Favg * 100 - Penalty
A common environment (workspace) with a Nvidia Tesla K80 GPU, 4 cores CPU and 16 GB of RAM was provided by the organizers. The virtual environment was used as a way to standardize the speed measurements for everyone’s solutions as FPS is a part of the submission score.
Data
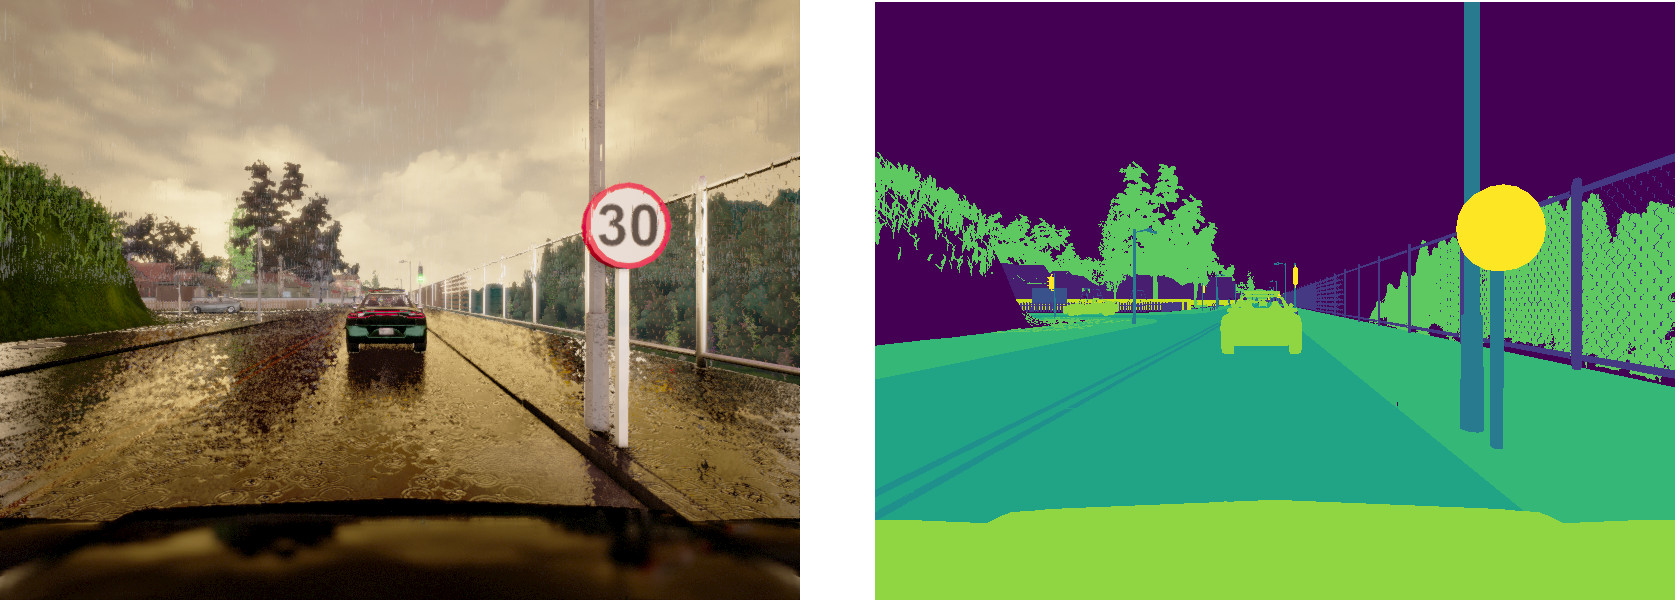
Official train dataset contains 1000 images with masks, generated by the CARLA simulator. Usually, more data means better results, that is why an additional dataset was collected manually with the simulator. Also, some extra datasets were provided by the community in the official #lyft-challenge Slack channel. All in all, there were 15601 images in train subset and 1500 in the validation one.
It is worth noting that the CARLA simulator is a great playground for self-driving research to generate a lot of images for multiclass Cityscapes-style semantic segmentation as well as simulate different sensors: lidar and “depth map” sensor. It comes with great documentation and an easy to set up python client for control of the environment simulation and the data acquisition.

A sample image generated by CARLA and its masks.
A video of 1000 frames generated with the simulator was used as the test data. It contains five episodes with different weather conditions merged together. The weather condition variation is the same as the original training dataset. The test was used as is, without splitting into private/public parts.